The Legacy Surveys are producing an inference model of the 14,000 square degrees of extragalactic sky visible from the northern hemisphere in three optical bands (\(g,r,z\)) and four infrared bands. The sky coverage is approximately bounded by -18° < δ < +84° in celestial coordinates and \(|b|\) > 18° in Galactic coordinates. To achieve this goal, the Legacy Surveys are conducting 3 imaging projects on different telescopes, described in more depth at the following links:
The Beijing-Arizona Sky Survey (BASS) |
The DECam Legacy Survey (DECaLS) |
The Mayall z-band Legacy Survey (MzLS) |
Contents of DR6
Data Release 6 (DR6) is the sixth public data release of the Legacy Surveys. It is the second public release of images and catalogs that combine the Beijing-Arizona Sky Survey and the Mayall z-band Legacy Survey (BASS and MzLS; DR5 comprised the fourth release of data from DECaLS). Imaging from the Legacy Surveys is first reduced through the NOIRLab Community Pipeline before being processed using the Tractor.
DR6 includes BASS images taken prior to June 25, 2017 and MzLS images taken prior to December 9, 2017. For the latest DECaLS images, see DR5 of the Legacy Surveys. The BASS and MzLS data in DR6 are reduced in a manner that is largely consistent with DECaLS reductions in DR5.
The table below indicates the area covered in DR6 for different numbers of passes and in different filters. These are precise area estimates derived from the geometry of CCDs that contribute to the Legacy Surveys footprint.
Band/Number of Passes |
≥ 1 |
≥ 2 |
≥ 3 |
|---|---|---|---|
\(g\)-band |
4380 deg2 |
3708 deg2 |
2376 deg2 |
\(r\)-band |
4374 deg2 |
3719 deg2 |
2649 deg2 |
\(z\)-band |
5231 deg2 |
4853 deg2 |
3622 deg2 |
All bands jointly |
3823 deg2 |
3110 deg2 |
1441 deg2 |
DR6 includes the stacked images and the Tractor-based catalogs. The size of the DR6 data distribution is:
Size* |
Directory |
Description |
|---|---|---|
30 GB |
Calibration files |
|
9.0 TB |
Co-added images, including χ², depth, image, model, nexp, and Quality Assurance PNG plots |
|
8.8 GB |
Matches to other catalogs (SDSS, etc.) |
|
1.9 GB |
Images of notable galaxies (NGC, etc.) |
|
22 GB |
Log files generated by Tractor processing |
|
182 GB |
Metrics |
|
147 GB |
Repackaged versions of the Tractor catalogs |
|
449 GB |
Tractor catalogs |
*Note that although the contents of a directory should be fixed for each Data Release, the size of a directory can change. This is typically due to updated file compression. So, the listed directory sizes should be viewed as (very reasonable) estimates.
For all of the Legacy Surveys, including BASS and MzLS, co-added images and Tractor catalogs are presented in "bricks" of approximate size 0.25° × 0.25°. Each brick is defined in terms of a box in RA,Dec coordinates. For the image stacks, we use a simple tangent-plane (WCS TAN) projection around the brick center. The projections for the \(g,r,z\) filters are identical. There are 662,174 bricks spread over the sky, meaning that each brick has an average area of 0.0623 deg2. The brick images have some overlap. The co-added images should be used with caution, as noted below in the Image Stacks section.
There are approximately 310 million unique sources in DR6 spread over 92,287 bricks.
Obtaining Images and Raw Data
Images from all 3 of the Legacy Surveys can be viewed directly using the Sky viewer and raw data can be obtained through the NOIRLab portal (see also the information near the bottom of the files page).
Sections of the coadd images in DR6 can be obtained as JPEGs or FITS files using the cutout service, as follows:
where \(bands\) is a string such as "\(grz\)","\(gz\)","\(g\)", etc.
Replacing layer=mzls+bass-dr6 with layer=mzls+bass-dr6-model or layer=mzls+bass-dr6-resid will instead return cutouts for the model and residual images, respectively.
The size of the image can also be specified using \(width\), \(height\) and \(size\), where \(size\) forces \(width\) and \(height\) to be equal. For example:
It is possible to retrieve multiple cutouts from the command line using standard utilites such as wget.
As of the writing of this documentation the maximum size for cutouts (in number of pixels) is 3000. Pixscale=0.262 (arcseconds per pixel) will return (approximately) the pixel scale used in the coadds. The native pixel scale of the Mosaic camera (used for \(z\) band) is approximately 0.262, and for the 90prime camera (used for \(g\) and \(r\) bands) it is approximately 0.454. For information on how to recover DECaLS cutouts, see the DR7 description page.
See also the list of URL/cutout patterns that are supported by the viewer.
Source Detection
The source detection uses a PSF- and SED-matched-filter detection on the stacked images, with a 6σ detection limit. The Tractor fitting step is initialized with these positions, although these positions can be changed during the fits and low-S/N sources can be removed.
For source detection, each image is convolved by its PSF model, then a weighted stack of these is created in order to optimize the point-source detection efficiency. Next, SED-matched combinations of the three bands are created, for two SEDs: "flat" (a source with AB color zero), and "red", a source with AB color \(g-r = 1\), \(r-z = 1\). Sources above 6σ are detected in each of these two SED-matched filters, as well as in each band independently.
As of DR5, source detection is run first in \(z\), then in \(r\), \(g\), "flat" and finally in "red". In DR4, DR3 and earlier data releases, source detection was run first in \(g\), then in \(r\), \(z\), "flat" and finally in "red".
PSF
The Tractor makes use of the PSF on each individual exposure. The PSF for the individual exposures are first computed independently for each CCD using PSFEx, generating spatially-varying pixelized models.
The configuration files for SExtractor and PSFEx that we used for a given iteration of our codebase are available on our github page.
Sky Level
The Community Pipeline removes a sky level that includes a sky pattern, an illumination correction, and a single scaled fringe pattern. These steps are described on the NOIRLab Community Pipeline page. This makes the sky level in the processed images near zero, and removes most pattern artifacts. A constant sky level is then added back to the image that is the mean of what was removed.
Additionally, we compute and remove a spatially varying (spline) sky model, by detecting and masking sources, then computing medians in sliding 512-pixel boxes.
Tractor Catalogs
The Tractor code runs within the geometrical region of a brick. This fitting is performed on the individual exposures that overlap the brick, without making use of the image stacks. This preserves the full information content of the data set in the fits, handles masked pixels without the need for uncertain interpolation techniques, and fits to data points without the complication of pixel covariances.
Morphological Classification
The Tractor fitting can allow any of the source properties or image calibration parameters (such as the PSF) to float. Only the source properties were allowed to float in DR6. These are continuous properties for the object centers, fluxes, and the shape parameters.
There is also the discrete choice of which model type to use. In DR6, five morphological types are used: point sources, round exponential galaxies with a variable radius ("REX"), deVaucouleurs profiles (elliptical galaxies), exponential profiles (spiral galaxies), and composite profiles that are deVaucouleurs + exponential (with the same source center). The total numbers of the different morphological types in DR6 are:
Number of Sources |
Primary Objects of Type |
|---|---|
313,512,903 |
All |
121,854,427 |
|
139,736,335 |
|
26,804,729 |
|
22,741,635 |
|
2,375,777 |
|
Note that, as of DR5, the "REX" model replaced the "SIMP" model used in DR4, DR3 and earlier data releases.
The decision to retain an object in the catalog and to re-classify it using models more complicated than a point source is made using the penalized changes to χ² in the image after subtracting the models for other sources. Here, the χ² value is calculated as a sum across all optical bands (i.e. \(g\), \(r\) and \(z\) for DR6). The "PSF" and "REX" models are computed for every source and the better of these two is used when deciding whether to keep the source. A source is retained if its penalized χ² is improved by 25; this corresponds to a χ² difference of 27 (because of the penalty of 2 for the source centroid). Sources below this threshold are removed.
The source is classified as the better of "point source (PSF)" or "round exponential galaxy (REX)" unless the penalized χ² is improved by 9 (i.e., approximately a 3σ improvement) by treating it as a deVaucouleurs or exponential profile. The classification is a composite of deVaucouleurs + exponential if it is both a better fit to a single profile over the point source, and the composite improves the penalized χ² by another 9. These choices implicitly mean that any extended source classifications have to be at least 5.8σ detections and that composite profiles must be at least 6.5σ detections.
The fluxes are not constrained to be positive-valued. This allows the fitting of very low signal-to-noise sources without introducing biases at the faint end. It also allows the stacking of fluxes at the catalog level.
Tractor Implementation Details
Tractor fundamentally treats the fitting as a χ² minimization problem. The current core routine uses the sparse least squares solver from the SciPy package, or the open source Ceres solver, originally developed by Google.
The galaxy profiles (the exponential and deVaucouleurs profiles mentioned above under Morphological Classification) are approximated with mixture-of-gaussian (MoG) models and are convolved by the pixelized PSF models using a new Fourier-space method (Lang, in prep). The galaxy profile approximation introduces errors in these models typically at the level of \(10^{-4}\) or smaller. The PSF models are treated as pixel-convolved quantities, and are evaluated at the integral pixel coordinates without integrating any functions over the pixels.
The Tractor algorithm could be run with both the source parameters and the calibration parameters allowed to float, at the cost of more compute time and the necessity to use much larger blobs because of the non-locality of the calibrations. A more practical approach would be to iterate between fitting source parameters in brick space, and fitting calibration parameters in exposure space. Such iterations will be considered and tested for future data releases. Another practical issue is that the current PSF models may allow too much freedom.
Photometry
The flux calibration for BASS and MzLS are on the AB natural system of the 90Prime and Mosaic-3 cameras, respectively. An AB system reports the same flux in any band for a source whose spectrum is constant in units of erg/s/cm²/Hz. A source with a spectrum of \(f = 10^{-(48.6+22.5)/2.5}\) erg/s/cm²/Hz would be reported to have an integrated flux of 1 nanomaggie in any filter. The natural system means that we have not applied color terms to any of the photometry, but report fluxes as observed in the 90Prime and Mosaic-3 filter systems.
Zero point magnitudes for the CP reductions of the 90Prime and Mosaic-3 images were computed by comparing Legacy Survey PSF photometry to Pan-STARRS-1 (PS1) PSF photometry, where the latter was modified with color terms to place the PS1 photometry on the 90Prime and Mosaic-3 camera systems. The same color terms are applied to all CCDs. Zero points are computed separately for each CCD, but not for each amplifier. The average color terms to convert from PS1 to 90Prime (for BASS) and Mosaic-3 (for MzLS) were computed for stars in the color range \(0.4 < (g-i) < 2.7\) as follows:
The brightnesses of objects are all stored as linear fluxes in units of nanomaggies. The conversion from linear fluxes to magnitudes is \(m = 22.5 - 2.5 \log_{10}(\mathrm{flux})\). These linear fluxes are well-defined even at the faint end, and the errors on the linear fluxes should be very close to a normal distribution. The fluxes can be negative for faint objects, and indeed we expect many such cases for the faintest objects.
The filter curves are available for BASS g-band, BASS r-band, MzLS z-band and MzLS z-band with corrections for the telescope, corrector, camera and atmosphere (at airmass=1.0). The BASS filter responses are described in Section 2.2 of the BASS project overview paper. The BASS filter curves were updated during the DR7 release, but the old filter curve for BASS g-band and old filter curve for BASS r-band (circa DR5) are still available.
As of DR6, PSF photometry uses the same PSF models (and sky background subtraction) for zeropoint-fitting as is later used in cataloging. This was not the case for DR5 or before. So, starting with DR6, the measured fluxes for PS1 stars should be completely self-consistent.
DR6 also contains WISE fluxes force-photometered at the position of Legacy Survey sources. The WISE Level 1 images and the unWISE image stacks are on a Vega system. We have converted these to an AB system using the recommended conversions by the WISE team. Namely, \(\mathrm{Flux}_{\mathrm{AB}} = \mathrm{Flux}_{\mathrm{Vega}} * 10^{-(\Delta m/2.5)}\) where \(\Delta m\) = 2.699, 3.339, 5.174, and 6.620 mag in the W1, W2, W3 and W4 bands. For example, a WISE W1 image should be multiplied by \(10^{-2.699/2.5} = 0.083253\) to give units consistent with the Tractor catalogs. These conversion factors are recorded in the Tractor catalog headers ("WISEAB1", etc). The result is that the optical and WISE fluxes we provide should all be within a few percent of being on an AB system.
Galactic Extinction
The most recent values of the Galactic extinction coefficients are available on the DR8 catalogs page.
Astrometry
Our astrometry uses the Gaia Data Release 1 system. Positions of sources are tied to predicted Gaia positions at the epoch of the corresponding Legacy Survey observation. The residuals are typically smaller than ±0.03″.
Astrometric calibration of all optical Legacy Survey data is conducted using Gaia astrometric positions of stars matched to Pan-STARRS-1 (PS1). The same matched objects are used for both astrometric and photometric calibration. There are some areas of sky where Gaia has "holes," i.e., where stars brighter than the Gaia magnitude limit are missing from the Gaia catalog. As a result, in some regions of the survey there are fewer matches to a given bright magnitude limit in the PS1-Gaia catalog than there are in the PS1 catalog that was used for astrometric calibration in, e.g., DR4 of the Legacy Surveys.
As of DR6, PSF photometry uses the same PSF models (and sky background subtraction) for zero-point-fitting as is later used in cataloging. This was not the case for DR5 or before. So, starting with DR6, the measured positions for Gaia stars should be completely self-consistent, substantially reducing any systematic errors in astrometry.
Image Stacks
The image stacks are provided for convenience, but were not used in the Tractor fits. These images are oversized by approximately 260 pixels in each dimension. These are tangent projections centered at each brick center, North up, with dimensions of 3600 × 3600 and a scale of 0.262″/pix. The image stacks are computed using Lanczos-3 interpolation. These stacks should not be used for "precision" work.
Depths
The histograms below depict the median 5σ (AB) depths for galaxies in areas with different numbers of observations in DR6.
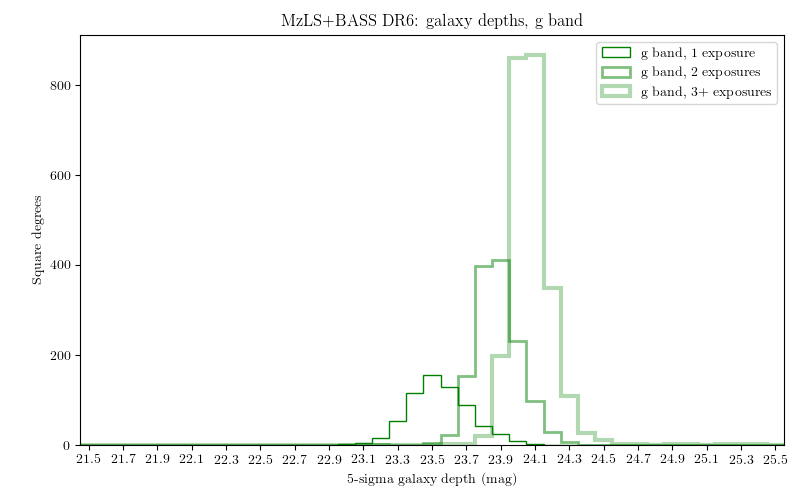
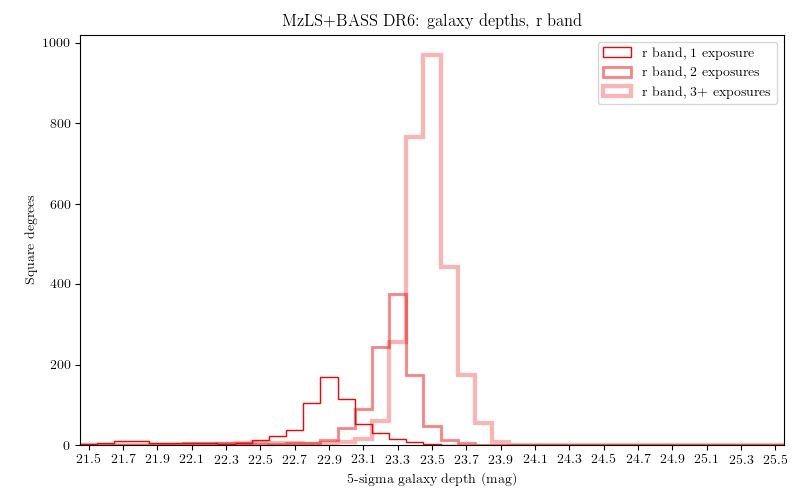
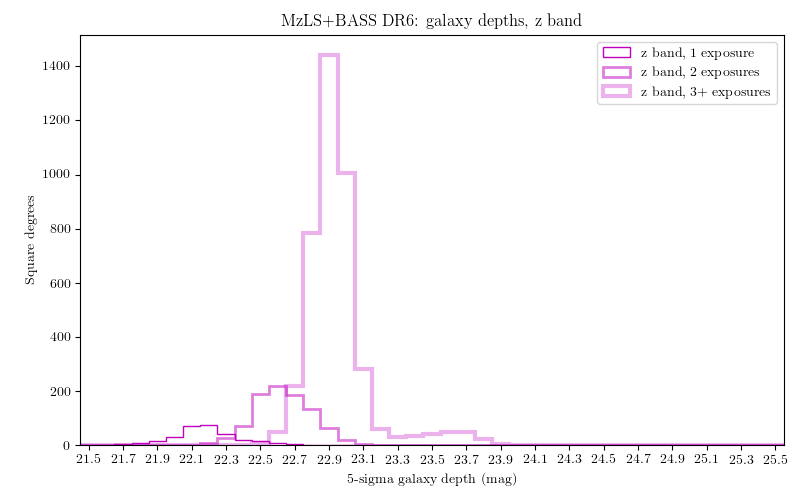
These histograms are based upon the formal errors in the Tractor catalogs for point sources, which need further confirmation. These depths can be compared to the predicted proposed depths for 2 observations at 1.5″ seeing of \(g=24.7\), \(r=23.9\), \(z=23.0\).
Code Versions
-
desiconda/20170818-1.1.12-img was used, except for the following three packages, for which a local build was created to bypass the desiconda build:
fitsio: git commit 844055b00de464ed87e1e7560d9e9c2a2e4dc138, tag v0.9.12rc1-21-g844055b
Astrometry.net: git commit: a5cb17a742cf0e66e5d0e09675b8c7e614aabcb9, tag 0.73-1-ga5cb17a
Tractor: git commit bc042691d58f6d684642cade435bdd2eff3a241e, tag dr6.2
-
LegacyPipe was upgraded twice to fix small bugs, but the bulk of the processing was done with the first version:
git commit 02a4d874a957c66da8d4a9b079299f74c9456a53, tag dr6.rc1
git commit 536e466dbb0d022e767835810858a50ffe0fe0fc, tag dr6.rc1.1
git commit 1b741bbd35e30d16f4d56ef673d3583baa335645, tag dr6.rc1.2
Note that Brick 1228p810 was processed with a different stack: desiconda 20170719-1.1.9-imaging, legacypipe dr6.rc1.1-18-g80be603
NOIRLab Community Pipeline: mixture of versions; recorded as
PLVER
Glossary
- BASS
- Blob
-
Continguous region of pixels above a detection threshold and neighboring pixels; Tractor is optimized within blobs.
- Brick
-
A region bounded by lines of constant RA and DEC; reductions are performed within bricks of size approximately 0.25° × 0.25°.
- CP
-
Community Pipeline (reduction pipeline operated by NOIRLab; https://legacy.noirlab.edu/noao/staff/fvaldes/CPDocPrelim/PL201_3.html).
- DECaLS
- DR2
- DR3
- DR4
- DR5
- DECam
-
Dark Energy Camera on the Blanco 4-meter telescope.
- maggie
-
Linear flux units, where an object with an AB magnitude of 0 has a flux of 1.0 maggie. A convenient unit is the nanomaggie: a flux of 1 nanomaggie corresponds to an AB magnitude of 22.5.
- MoG
-
Mixture-of-gaussian model to approximate the galaxy models (https://arxiv.org/abs/1210.6563).
- MzLS
- NOIRLab
-
The NSF's National Optical-Infrared Astronomy Research Laboratory.
- nanomaggie
-
Linear flux units, where an object with an AB magnitude of 22.5 has a flux of \(1 \times 10^{-9}\) maggie or 1.0 nanomaggie.
- PSF
-
Point spread function.
- PSFEx
- SDSS
- SDSS DR12
- SDSS DR13
- SED
-
Spectral energy distribution.
- SourceExtractor
- SFD98
-
Schlegel, Finkbeiner & Davis 1998 extinction maps (https://ui.adsabs.harvard.edu/abs/1998ApJ...500..525S/abstract).
- Tractor
- unWISE
-
New coadds of the WISE imaging, at original full resolution (http://unwise.me, https://arxiv.org/abs/1405.0308).
- WISE